CCHO INFOGRAPHICS

NEW! “RHNA TellS HER STORY” INFOGRAPHIC
In its newly released infographic, CCHO breaks down the Bay Area’s Regional Housing Needs Allocation (RHNA). The graphic serves an educational tool for the public to better understand how it works:
What is RHNA?
How does the RHNA process work?
What does RHNA have and not have the power to do?
What do RHNA numbers mean?
What are its implications for affordable housing in the Bay Area?

How Development Works
The infographic illustrates a step-by-step process serving to demystify development based on the San Francisco system. It is designed to better inform the public dialogue, and paints a more honest picture of the construction process that can help inform more impactful development policy solutions. Read the Medium article.
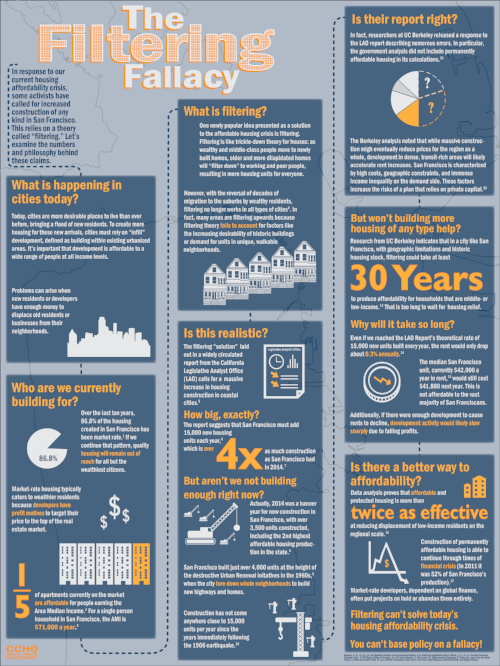
The Filtering Fallacy
The rationale behind recently-proposed “solutions” to the housing affordability crisis that seek to reduce limits and regulation on high-end housing development policy is the theory of Filtering.

A JOBS-HOUSING FIT
A Jobs-Housing Fit seems like the simplest of ideas: the housing that a region plans for and builds should match the needs of the people that live there now and in the future.